Diffusion and Osmosis
Problem: What are the effects of a selectively permeable membrane on diffusion and osmosis between two solutions separated by the membrane?
Introduction:
Diffusion is the random movement of molecules from an area of higher
concentration to an area of lower
concentration.
Osmosis is a special case of diffusion. Osmosis is the diffusion of water through a selectively permeable membrane from a region of higher water potential to a region of lower water potential.
In this experiment you will measure diffusion
of small molecules through dialysis
tubing, an example of a selectively permeable membrane, but larger molecules
will pass through more slowly, or perhaps not at all. The movement
of a solute through a selectively permeable membrane is called dialysis. The size of the minute pores in the dialysis
tubing determines which
substances can pass through this membrane.
Procedure:
1. Obtain a 30-cm piece of dialysis tubing that has been soaking in water. Tie off one end of the tubing to form a bag. To open the other end of the bag, rub the end between your fingers until the edges separate.
2. Place 15 ml of the 15% glucose/1% starch solution in the bag. Tie off the other end of the bag, leaving sufficient space for the expansion of the contents in the bag. Record the color of the solution in Table 1.1.
3. The teacher will test the 15% glucose/1% starch solution for the presence of glucose/starch using Lugol’s solution. Record the results in Table 1.1.
4. Fill a 250-ml beaker or cup two-thirds full with distilled water. Add approximately 4 ml of Lugol’s solution to the distilled water and record the color of the solution in Table 1.1. Your teacher will test this solution for glucose. Record the results in Table 1.1.
5. Immerse the bag in the beaker of solution.
6. Allow your set-up to stand for approximately 30 minutes or until you see a distinct color change in the bag or in the beaker. Record the final color of the solution in the bag, and of the solution in the beaker, in Table 1.1.
7. Test the liquid in the beaker for the presence of glucose. Record the results in Table 1.1.
TABLE 1.1
Initial Contents Solution Color Presence of Glucose
![]()
![]()
![]()
![]()
![]() Initial Final Initial Final
Initial Final Initial Final
BAG 15% glucose/ 1% starch
BEAKER Water + Iodine
INITIAL MASS _____________________________ grams
FINAL MASS ______________________________ grams
CHANGE IN MASS _________________________ grams
Diagram:
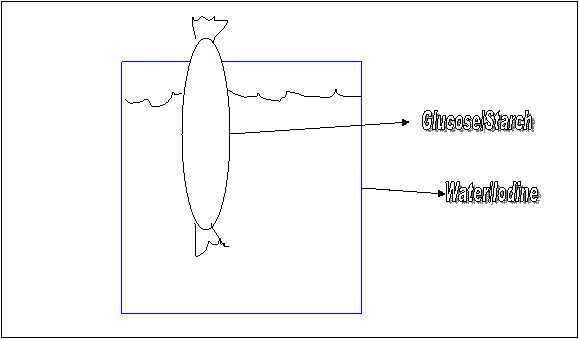
Using arrows, illustrate what substances diffused through
the membrane and the direction they moved (into or out of the bag.)
Analysis of
Results
1. Which substance(s) are entering the bag and which are leaving the bag? What experimental evidence supports your answer?
2. Explain the results you obtained. Include the concentration differences and membrane pore size in your discussion.
3. Quantitative data uses numbers to measure observed changes. How did the mass of your dialysis bag change through the course of this experiment? Please explain what happened to cause this quantitative change.
4. Based on your observations, rank the following by relative size, beginning with the smallest: glucose molecules, water molecules, iodine molecules, membrane pores, starch molecules.